Stellar coin has enjoyed a 24 hour price increase of 5.79%. The cryptocurrency giant currently trades at a price of $0.2320 after a 10.35% price hike over the past 7 trading days.
Stellar, XLM, was created in 2014 when the founder Jeb McCaleb forked Ripple to create Stellar Lumens. Stellar was intended to enable low cost interbank transactions across countries in less than 5 seconds. It is created to connect individuals, institutions and payment systems to create an integrated finance platform. Stellar has the long term vision to expand financial access worldwide.
Stellar has had a wave of publicity from exchanges announcing the addition of XLM to their platforms. Coinbase has recently announced that they were exploring the addition of Stellar to their platform, causing price to increase by over 15% on the announcement. Along with Coinbase, the global remittance company Tempo Money Transfer has partnered with Stellar to allow users to send funds to anyone in the Philippines using just a name and telephone number via their integration with Coins.ph.
Stellar is currently ranked in 7th place in terms of overall market cap across the entire industry, with a total market cap value of $4.35 billion. This is a significant $4.19 billion lower than the market cap high witnessed on April 24th 2018 with a total value of $8.54 billion, as shown in the diagram below.

Let us continue to analyse Stellar price action over the long term.
Price Analysis
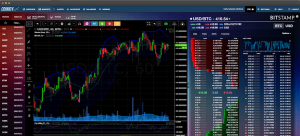
XLM/USD – LONG TERM – DAILY CHART

Analysing the market from the long term perspective above, we can see that Stellar had experienced a price increase of over 2350% when the market rose from a low of $0.0208 on the 5th of November 2017 to an all time high of $0.9823 placed on the 4th of January 2018.
After placing this all time high, understandably, the market began to fall. Price action originally fell to support at the .618 Fibonacci Retracement priced at $0.40 during January. This is a Fibonacci Retracement of the entire bullish run described above.
The market continued falling throughout the year until reaching a yearly low price of $0.1516 in March 2018. This level is supported by the .886 Fibonacci Retracement level at the same price.
Since mid-June, the market has been trapped within a range bound market condition between the boundaries of the .886 Fibonacci Retracement priced at $0.1516 and the .786 Fibonacci Retracement priced at $0.2452. The market has also been trading under the 100 day moving average for over two months.
Let us continue to analyse price action over the more recent period to highlight any potential support or resistance areas.
XLM/USD – SHORT TERM – DAILY CHART

Analysing the market over a shorter time period, we can see that Stellar had experienced another bullish run during April when price action rose from a low of $0.1679 on the 30th of March 2018 to a high of $0.4723 experienced on the 3rd of May. This was a price increase of over 180% from low to high.
During May the market began to fall, originally finding support at the short term .50 Fibonacci Retracement level priced at $0.32. However, the market pushed the market lower, pushing price action below the 100 day moving average and toward the .618 FIbonacci Retracement level priced at $0.2844.
The market continued on lower during June as price action fell lower only eventually completing a 100% Fibonacci Retracement to the initial base price seen on the 30th of Match priced at $0.169. It is also important to highlight that this area of support is also bolstered by a downside 1.618 Fibonacci Extension. This is a Fibonacci Extension measured from the high seen on May 3rd to the low seen on the 11th of May.
Price action is currently trading at resistance located at the short term .786 Fibonacci Retracement priced at $0.2341. This resistance level also correlates with the 1.272 FIbonacci Extension level priced in the same area. If the market can overcome this strong area of resistance then the nearest level of further resistance will be located at the 100 day moving average which is currently hovering around the $0.26 handle.
If the bulls can push the market eventually above the 100 day moving average then further near term resistance can be located at the .618 FIbonacci Retracement priced at $0.2844 followed by the .50 Fibonacci Retracement priced at $0.32. If the market can overcome $0.32 then it will be placing fresh 2 month highs.
Alternatively, if the bears step back into the market and push price action lower then immediate support can be expected at the .886 Fibonacci Retracement level priced at $0.20. This area should provide ample support but if the bears manage to push prices lower, further support can be located at the downside 1.618 Fibonacci Extension level priced at $0.169.
The technical indicators are currently leaning toward the favour of the bulls at this moment in time. The RSI indicator is currently trading well above the 50 handle indicating the increased momentum recently witnessed over the passed trading week. If the RSI can continue to stay above the 50 handle, we can expect the bullish momentum to continue within the market.
Similarly, the moving average indicators are showing promising favour toward the bulls in the market. Over the past trading session, the 7 day EMA (blue line) has crossed above the 21 day EMA (purple line) indicating a bullish crossover. If these moving averages can continue to diverge away from one another this will indicate that the bullish trend is increasing in momentum.
CONCLUSION
Stellar has had a rich history of development and partnership announcements. The recent announcement from Coinbase exploring the addition of Lumens will certainly increase the accessibility of Stellar to the mainstream audience that are signed up to the platform and help increase the awareness of the cryptocurrency gem.
We will continue to monitor updates from the team as future exciting partnerships have the potential to help Stellar return to its previous all time highs.

 The word "
 Indeed everyone requires some kind of information regarding the sites they will invest in. Therefore,
 The term "forex scam" refers to any scheme that is designed to defraud traders by using deceit, such as persuading investors that trading on the currency market would result in significant profits. In a nutshell, the market for foreign exchange is a zero-sum game, meaning that if one individual is successful, another is unsuccessful.
 Foreign exchange trading is a legal way to supplement your income. However, as its popularity has grown, so has the number of forex scammers.
")
 XT.com is proud to announce its upcoming CARES (1BCARES) listing on its platform. This collaboration will enable both networks to expand their reach in helping various humanitarian and socio-economic causes around the world. The token will be available in the exchange’s Mainzone (MEMEs) section.
 Choise.com (CHO), the world’s first MetaFi (CeFi and DeFi) ecosystem, has announced the launch of the US$5,000,000 Celebration Pool.
 From self-driving vehicles joining the growing city taxi force to digital support booking restaurants reservations, Artificial Intelligence (AI) technology is stamping its authority continuous in our daily lives.
 Verolian Opiyo
 The internet changed the way traditional investment has been done and broadened access to individuals to explore how to trade and invest directly on newly surfaced online platforms. More and more investors are growing more comfortable with foregoing a third party or broker and are taking investing into their own hands. According to Investopedia

 My interest in Blockchain technology and crypto started when I was an undergrad. It has since then transformed into something much bigger for me. I believe that Blockchain is undoubtedly the future of technology as we know it, and have been trying to share as much knowledge as I humanly can with people.
 Are you already familiar with cryptocurrencies, trading, maybe you are even registered on several exchanges? Great. Now it’s time to learn all the intricacies of cryptocurrency trading and answer the question: “How to trade cryptocurrency?” In this article, we`ll tell you about such advanced orders as Stop Loss, Take Profit, and Trailing Stop. You will master the theory (yes, boring terms will be here too), learn about their advantages and disadvantages, and also be able to decide what to add to your trading arsenal.
 Gleb MyrkoCrypto Marketer & CEO
 Let’s assume that we're able to give a super intelligent AI orders and it follows those orders; it may just take the quickest and easiest route to solve them. Just because we make a super intelligent AI, that doesn't mean that it's going to be wise.
There's a difference between intelligence and wisdom; Intelligence is more about making mistakes and acquiring knowledge and being able to solve problems through that. Wisdom, on the other hand, is about applying the correct knowledge in the most efficient way. Wisdom reflects on being able to see beyond the intelligence gained and being able to apply that to other things, hopefully, in a productive way. If we give AI an order to solve world hunger, the easiest way to solve world hunger is just to kill all life on the planet and then nothing would ever be hungry again.
The solution of such a problem comes down to Data and how we crunch the right Data to feed Artificial Intelligence concepts.
Nowadays Data and the way it’s distributed is one of the key fundamentals on which new solutions are built. Blockchain is clearly the buzzword of our age, and yet, few actually easily understood the principles behind it; especially how it differentiates itself from a traditional distributed database.
There is much confusion as to what a blockchain is and its dichotomy with a database. A blockchain is actually a database because it is a digital ledger that stores information in data structures called blocks. A database likewise stores information in data structures called tables. However, while a blockchain is a database, a database is not a blockchain. They are not interchangeable in a sense that though they both store information, they differ in design. There is also a difference in purpose between the two, which is perhaps what is not clear to those who want to understand why blockchains are needed and why databases are better suited for storing certain data.
Let’s assume that we're able to give a super intelligent AI orders and it follows those orders; it may just take the quickest and easiest route to solve them. Just because we make a super intelligent AI, that doesn't mean that it's going to be wise.
There's a difference between intelligence and wisdom; Intelligence is more about making mistakes and acquiring knowledge and being able to solve problems through that. Wisdom, on the other hand, is about applying the correct knowledge in the most efficient way. Wisdom reflects on being able to see beyond the intelligence gained and being able to apply that to other things, hopefully, in a productive way. If we give AI an order to solve world hunger, the easiest way to solve world hunger is just to kill all life on the planet and then nothing would ever be hungry again.
The solution of such a problem comes down to Data and how we crunch the right Data to feed Artificial Intelligence concepts.
Nowadays Data and the way it’s distributed is one of the key fundamentals on which new solutions are built. Blockchain is clearly the buzzword of our age, and yet, few actually easily understood the principles behind it; especially how it differentiates itself from a traditional distributed database.
There is much confusion as to what a blockchain is and its dichotomy with a database. A blockchain is actually a database because it is a digital ledger that stores information in data structures called blocks. A database likewise stores information in data structures called tables. However, while a blockchain is a database, a database is not a blockchain. They are not interchangeable in a sense that though they both store information, they differ in design. There is also a difference in purpose between the two, which is perhaps what is not clear to those who want to understand why blockchains are needed and why databases are better suited for storing certain data.